


Maps reveal persistence of damaging effects of historic redlining practices
During the Great Depression, the Home Owners’ Loan Corporation spent nearly $3 billion to rescue the distressed mortgages of more than a million homeowners.
The New Deal agency has since been broadly recognized for saving the housing sector. But it has also been vilified for institutionalizing racism through a practice known as redlining — tinting maps of certain neighborhoods scarlet, which effectively withheld capital from African-American families and reinforced urban poverty.
To shine light on the home financing inequities of the time, a team of researchers from Johns Hopkins University, the University of Maryland, the University of Richmond, and Virginia Tech have launched Mapping Inequality: Redlining in New Deal America, an online repository of historic maps of 225 U.S. cities. The website offers unprecedented, digitally interactive access to the national collection of “security maps” and area descriptions that the Home Owners’ Loan Corporation produced between 1935 and 1940.
“In the 1930s, as many as one-half of all home mortgages were in default,” said LaDale Winling, an assistant professor of history in Virginia Tech’s College of Liberal Arts and Human Sciences and one of four research team leaders. “Default mortgages were both causes and symptoms of the Great Depression. So when the Home Owners’ Loan Corporation was formed, it was viewed as a savior of the housing sector. Eventually, though, it became clear that it had also become a force for institutionalized racial segregation.”
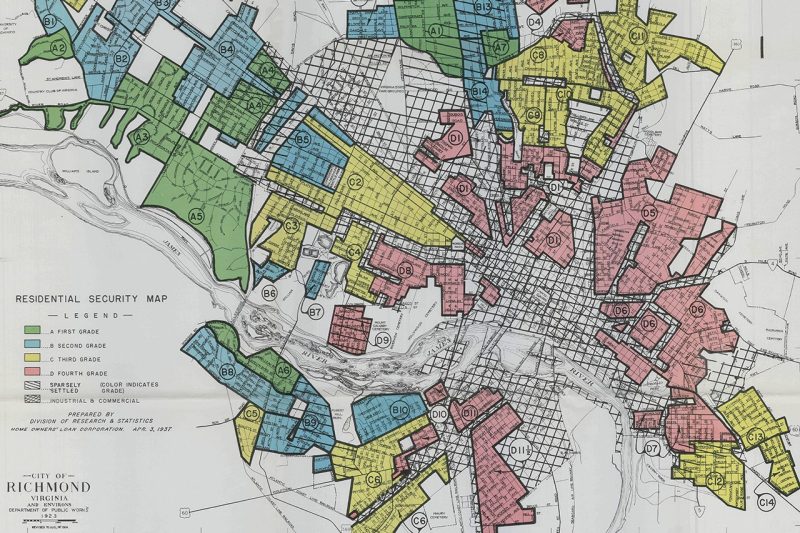
Mapping Inequality allows visitors to view Depression-era America as investors and real estate developers saw it — valuations of “good” and “bad” neighborhoods in patchworks of colors that reflected racial lines. The green areas were considered the best investments. Blue areas were considered still desirable, while those marked yellow were in decline. Last came red — areas deemed hazardous for investors.
“Once a neighborhood was no longer wealthy white, it was considered at risk, both demographically and environmentally,” Winling said. “Throughout the 1930s African-American activists accused the agency of discriminating against blacks and freezing them out of federal programs. The feeling was that the government played a significant role in racial discrimination through the real estate and home financing sectors.”
A key factor, Winling added, was the way the government, in partnership with private lenders, disinvested in central cities and encouraged relocations to suburbs.
“We often think of real estate development as the natural process of the free market,” Winling said. “But these maps show that the shape of the housing market was already determined, set in collaboration between federal officials and local leaders in real estate and banking. Their valuations were based on dominant ideas about segregation — that there should be one housing market for blacks and one for whites and one set of neighborhoods for blacks and another for whites. The federal government was basically subsidizing both segregation and suburbanization.”
The history of redlining continues to have repercussions for many present-day cities, Winling added. “Visitors to Mapping Inequality can use the maps and area descriptions to draw connections between past state actions — and inactions — and contemporary conditions in the United States.”
In addition to Winling, the research team leaders are N.D.B. Connolly, the Herbert Baxter Adams Associate Professor of History in the Krieger School of Arts and Sciences at Johns Hopkins University; Richard Marciano, a professor of information studies and director of the Digital Curation Innovation Center at the University of Maryland; and Robert Nelson, director of the Digital Scholarship Lab at the University of Richmond.
“Maps offer a compelling visual way to making sense of data,” Winling said. “We hope Mapping Inequality will help inform discussions of racial and urban inequalities in the United States. We also hope these maps will shed light on how we got the cities we did.”


