


Making complex data approachable through art and information design

Michael Stamper, University Libraries at Virginia Tech's data visualization designer, plays a unique role in the research process by transforming faculty and student clients’ complex research data into vibrant, interactive, and dynamic visualizations to better communicate their findings to a broad audience.
Modern research libraries are places to acquire traditional ingredients for solid research and academic endeavors. They are also where faculty and students tap resources, expertise, and spaces to create a finished product.
“Many academic libraries have data and visualization services,” said Stamper, “but to my knowledge, none of them have a data visualization designer to help take rendering data or designing information to the next level by formatting and shaping them to be more impactful, engaging, and insightful.”
Stamper is a designer first. He holds an undergraduate degree in graphic design, studio art, and art history and a Master of Fine Arts degree in graphic and interactive design. His artistic interests include traditional drawing, painting, printmaking, and letterpress work with metal and wood type.
His professional background is as diverse as his creative expertise. He’s served as an assistant professor of graphic design at Minnesota State University-Moorehead and an art director and designer at the largest advertising and public relations firm in Indianapolis and at Indiana University.
While pursuing his master’s degree at Indiana University-Bloomington, Stamper realized a keen need for artists and designers to help communicate research. “I started my graduate studies, focused on data visualization, information architecture, and human-computer interaction while I was a full-time art director and designer at Indiana University,” said Stamper. “I switched to the MFA program because I realized that there was and is a definite need for creative-types to be a part of scientific research teams.”
Stamper said that although research faculty have different wants than traditional public relations or advertising clients, they all need to communicate an idea or concept to their target audience.
In the University Libraries at Virginia Tech, Stamper’s work ranges from creating custom infographics to rendering large abstract networks of data and everything in between.
“If a researcher is working on a publication or proposal, I help them by providing infographics or visualizations to support and communicate their data and research. If they have an idea or sketch for something they’d like to use or need to use they can come to me,” said Stamper. “In this way, I free the researchers up to focus on their writing by creating the graphics, diagrams, or visualization that communicate effectively to their target audience. All the projects that come across my desk are unique. That makes my job interesting.”
Stamper gets excited when he can share the work that he has done. One such project was an ICAT mini-SEAD grant-funded project for developing an online tool for students to visualize and explore acid-conjugates. This project resulted in a beta version of the tool and a poster titled “Design Thinking for Visualizing Acid-base Chemistry,” which Stamper presented at the Gordon Research Conference: Visualization in Science and Education.
“Some of the most fun visualizations I’ve worked on are projects that can be taken beyond the initial data or information visualization design request and transformed into multiple pieces for that researcher and their team,” said Stamper. “For instance, one online project went from a simple mockup of an interface to interact with a visualization, to a conference poster outlining the design process, and a presentation that explained all the aspects of the planning, design, creation, and sharing that process with others.”
He also wrote an editorial, I am a data visualization designer in an academic library, and more!, for an Association of College and Research Libraries Digital Scholarship publication. Stamper’s role in the University Libraries is unusual, and other universities are interested in how the library structures and provides its data services to Virginia Tech researchers.
“The demand for my services is steady, and I have three years worth of work from Virginia Tech that I can’t show to the public because of patron privacy, which we take very seriously in the library,” said Stamper. “I hope this work results in an increased rate of approved and funded grant proposals. I also strive to teach students good visualization and information design concepts. Virginia Tech has a wide range of students studying computer science and engineering to humanities disciplines, and all of them need to present their own research visually. I help them learn how to do that and do it effectively.”
Stamper welcomes unusual projects. He says it keeps his job challenging and rewarding.
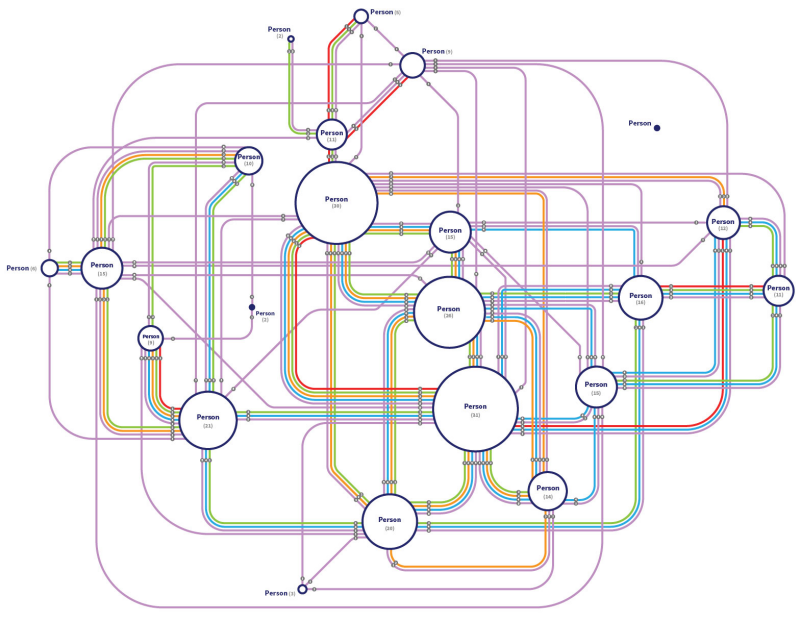
“The quirkiest visualization I’ve done at Virginia Tech involved transforming a complex network visualization into a more understandable London-style Tube map,” said Stamper. “This demonstrates taking an analytic rendering of data and how applying color, typography, layout, or STEM to STEAM to it transforms it into something easier to read by a wider audience — it’s also more fun.
“I often use the metaphor that I’m kind of like a baseball outfielder,” said Stamper. “It’s not up to me what comes my way. But when it does, I’m there to take care of it, which can sometimes be unusual — in a good way!”