


Hokies help bend trend in New River Valley
Most sports fans know the value of preseason predictions begin to diminish as soon as the games start.
Predicting the fight against COVID-19 can be similar — and the Virginia Tech community is helping the New River Health District far outperform some projections of the virus’s spread.
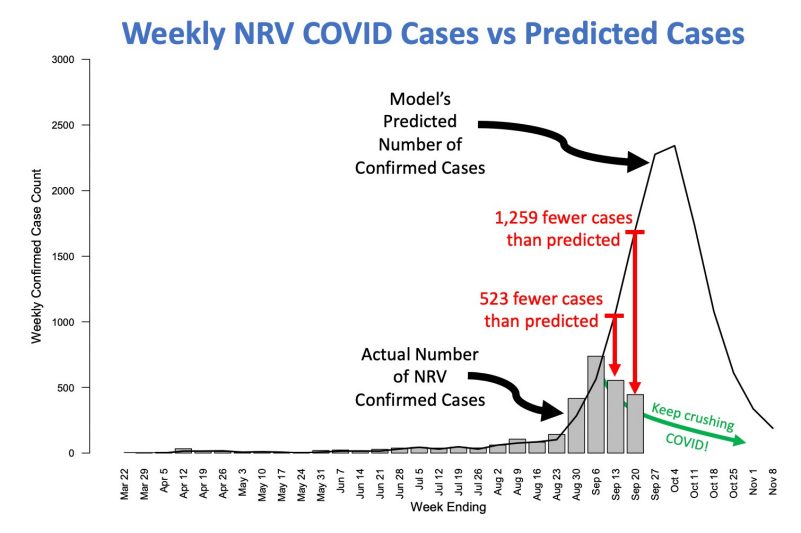
In recent weeks, the Virginia Department of Health’s COVID-19 model explorer predicted the New River Valley on an upward trend, projecting more than 1,700 new confirmed cases that week by Sept. 20, but the region only had 446 cases last week.
“When you see this kind of departure between the real data and the model, it’s telling us that people really are doing the positive things it takes to control the disease,” said Laura Hungerford, professor and head of the Virginia Tech Public Health Program in the Virginia-Maryland College of Veterinary Medicine.
The Virginia Department of Health has used the COVID-19 model explorer, developed at the University of Virginia, as a public-facing tool for planning.
Hungerford and Ron Fricker, professor of statistics and an associate dean in the College of Science, have co-led the Virginia Tech coronavirus modeling effort throughout the pandemic. Some of the predictions of the multidisciplinary team of faculty, students, and analysts have resembled the predictive growth trends shown by the U.Va. model. That work has been used by the university to plan precautions to mitigate the virus and to communicate the importance of embracing the precautions.
“We did this type of modeling all summer long and then put interventions in place,” Fricker said. “We now have clear evidence these actions worked. The curve could have trended upward like that, but it didn’t because of the things the Hokie community – students, faculty, staff, and all of Blacksburg – have done.”
And that evidence can be the path forward.
“Because of our community’s embracing of the precautions we set up, we now have data to confirm they work and support that if continued, we can continue offering students classroom instruction and campus experiences to the greatest extent possible while also mitigating the risk of a future outbreak,” said Executive Vice President and Provost Cyril Clarke.
Fricker and Hungerford said it’s common for the forecasts of such models to differ from real-time data because models are developed using assumptions about human behavior in certain situations. When people take the initiative to change those behaviors and/or situations, the result is often an outcome different from the prediction, which should feel empowering to community members.
“The right way to use models is to look at what the model predicts and say, ‘I don’t like this. How do I change this?’” said Hungerford. “The wrong way is to look at model and say, ‘Oh my gosh,’ and start panic-buying TP. The model is really just a tool to help us make better decisions.”
While the university used models to make many decisions that have helped to bend the trend of COVID-19 cases downward, Hungerford and Fricker said the students have been critical to this success. The downward trend indicates that the majority of students have embraced public health guidelines and avoided potentially dangerous situations, such as crowded indoor spaces or parties.
“What the students have done and how they have chosen to stop this is different from some other universities. They’ve been amazing,” Hungerford said.
And with methods of mitigation now proven effective, the vigorous continuation of those practices will be needed for continued success, especially entering the cooler months.
“Masks and distancing are even more important as we transition to spending more time indoors in the fall,” Fricker said. “But we now see that it is possible to successfully complete the semester if we stay vigilant and keep doing what we’re doing.”
For a deeper dive into the data, visit the VDH site, click on New River, and then scroll over the bars in the bar chart. To see the model, visit this VDH web page, click on “Geography Type” and select “Local Health District,” and then click on “New River.” When you scroll over the lines, the numbers are visible.
In the week ending Sept. 13, the New River Health District registered 554 confirmed cases, while the “adaptive” curve of the predictive model suggested 1,077 cases. In the week ending Sept. 20, there were 446 cases, compared to a prediction of 1,705 cases. The model is now updated to predict numbers for the week ending Sept. 27, and the predictions are lower than last week.
— Written by Travis Williams